Total Blocking Time (TBT) is a load responsiveness metric that measures the usability of the web page during the loading. Total Blocking Time is an important user-centric performance metric that compares the time amount of non-responsive and responsive time during the rendering phase of the web page.
Input responsiveness or the interactivity between the web page and user during the loading are related to the “Long Tasks”. Long tasks are blockers for the Main Thread of the Browser that are longer than 50 MS. Long Tasks are blockers because Browser can’t interrupt or stop a task and during the long task, the browser can’t respond to the users’ input. Total Blocking Time is closely related to First Input Delay and First CPU Idle web page performance metrics. First Input Delay measures when a user can interact with the web page as much as possible earlier while First CPU Idle measures when the first time that browser’s main thread is idle and can respond to the user.
Total Blocking Time measures the total time that the browser’s main thread is blocked by tasks longer than 50 ms. If TBT is optimized, load-responsiveness will be better and First Input Delay, First CPU Idle also will create a better user experience. If a web page can’t respond to the users’ input longer than 50 MS, users will notice the delay. You may check the graph that shows the Total Blocking Time visually below to understand the term better.
Example of tasks during the web page loading process for the browser’s main thread. Every task that longer than 50 MS is a long task. And every MS after the first 50 MS for every Long Task will be counted as Total Blocking Time. Total Blocking Time (TTB) is being measured between First Contentful Paint (FCP) and Time to Interactive (TTI).

You may see the Total Blocking Time calculation example below for these example tasks.

In this example, we have 345 MS as Total Blocking Time in sum.
What is the Relation Between Total Blocking Time and Time To Interactive
Total Blocking Time (TBT) is also related to the Time to Interactive (TTI) like First Input Delay (FID) and First CPU Idle. If the main thread of the browser doesn’t encounter a long task for 5 seconds, Time to Interactive happens. Time to Interactive is a necessary metric for understanding that when the web page is “fully” and “continuously” interactive. Thus, Total Blocking Time and Time to Interactive are complementary terms to each other. Without the Total Blocking Time, Time to Interactive can’t give the right User Experience situation solely. Let’s examine the example below, to understand this situation, better.
If there are only five long tasks that take 51 MS for the browser’s main thread that spread out to the 12 seconds during the loading of the web page, it means that our TTI will happen in the 17th second of the loading. Without the Total Blocking Time, we couldn’t understand that when and in which proportion the browser lets the user interact with the web page. In this example, the Total Blocking Time is only 3 MS. It means that most of the time, users can interact with the web page without notice of a significant delay. To understand and measure the User Experience (UX) and Load Responsiveness, Total Blocking Time and Time to Interactive should be used together.
How to Measure the Total Blocking Time
Total Blocking Time is a lab metric so it can be measured with Page Speed simulators. The tools and services that help for Total Blocking Time calculation and measurement are listed below.
- Lighthouse
- Chrome DevTools
- WebPageTest
- GTMetrix
- SpeedCurve
- Pingdom
- Puppeteer (Suggested for Holistic SEOs)
To understand the Total Blocking Time’s effect on the User Experience, using First Input Delay measurement in the field data can be useful because according to the users’ behavior patterns, the TBT can change in a wide range.
What is a Good Total Blocking Time?
A good Total Blocking Time should be less than 300 MS in a average device and network connection. Lighthouse measures the Total Blocking Time by summing up the Long Tasks’ total blocking effects and comparing it with the top 10.000 web sites’ TBT Score. The 404 pages and assets are also counted in this measurement.
Total Blocking Time classifying thresholds:
- Between the 0 and 300 MS are good and as labeled green in Lighthouse.
- Between the 300 and 600, MS are moderate and labeled as Orange in Lighthouse.
- Over 600 MS is bad and labeled as red in Lighthouse.
How to Determine the Total Blocking Time’s Causes
To improve Total Blocking Time, the Long Tasks should be determined and optimized. To determine the Long Tasks during the web page loading process, Chrome DevTools can be used. You may see an example of Long Tasks during the loading from Chrome DevTools below.

Too see the what causes the Long Tasks, you should click on the Long Task and check the “Bottom Up” section from the Chrome DevTools like below.

As you may notice, we have a “appendChild” event with four sub-process. At the right section, you will see the Javascript Code that starts the Long Task. If you click on that determined JavaScript File, you will see the code block that starts the “appendChild” event as below.

As you may see that in the 12605th line, we have a “d.appendChild(b)” command that starts our long tasks. This is a compiled Javascript. Compiled Javascript means that all of the variables, commands, selectors are shortened for decreasing the total file size. Thus, understanding the code is harder but if you are a Holistic SEO, you may see the optimization opportunities quickly. After, finding the causes of the Total Blocking Time, we may proceed for optimizing them.
How to Optimize Total Blocking Time
After determining the Long Tasks and the code blocks and web page assets that are causing them, optimizing Total Blocking Time can be possible. To optimize the Code Blocks that busy the main thread longer than 50 MS, the methods below can be used.
- Reduce the Request Count of the Third-Party Scripts
- Reduce the Size of the Third-Party Scripts
- Minimize the Browser’s Main Thread Work
- Clean the Unused Javascript and CSS Codes
- Compress the Javascript and CSS Files
- Implement the Code Splitting for Javascript Assets
All of these methods are useful and beneficial for mostly every web page performance metrics, below, we will handle these methods in terms of Total Blocking Time Optimization.
1.Reduce the Request Count of the Third Party Scripts to Optimize Total Blocking Time
Third Party Scripts can reduce the web page performance tremendously. Below, you will see the total impact of the third-party scripts for all of the web in scale.
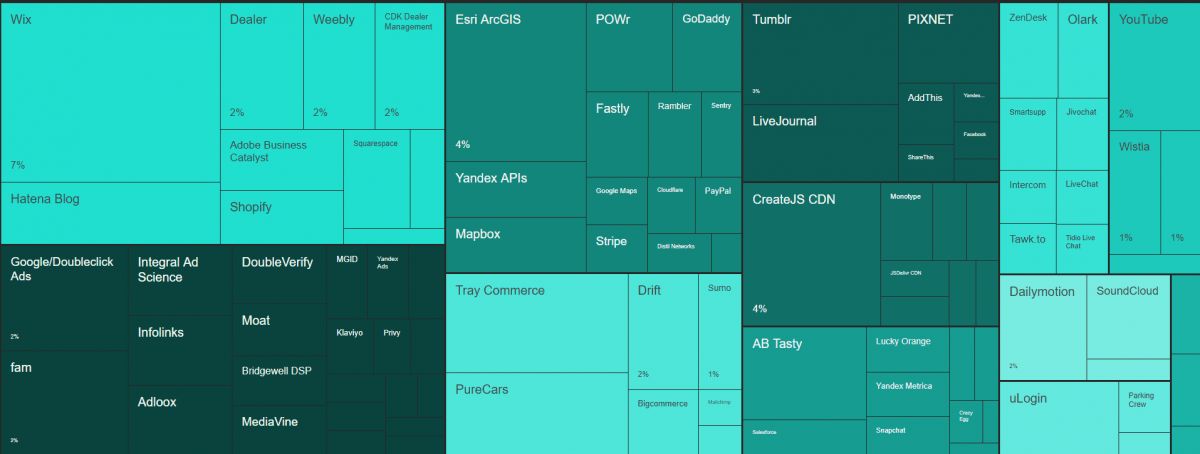
As you may see that on the web there are lots of third party script kind and all of them have different impact levels on the web pages. Below, you will see some effects of the third-party scripts on web page performance below:
- Creating new network requests
- Stalling the browser’s main thread with long tasks
- Including large image and video assets that are not being optimized
- Uncompressed and Unrefacted third-party scripts are out of control
- Using harmful Javascript Code Structures such as “document.write()”.
- Too long and expensive CSS Selectors usage
- Blocking the “window.Onload” event with unoptimized “iframes”.
- Lacking HTTP Caching
- Slow Response Times from the servers
- Blocking the content displaying without “progressive rendering”.
Because of all these reasons, third-party scripts are important factors that affect the Total Blocking Time. Thus, reducing the third-party scripts count is crucial and beneficial in terms of total blocking time. I recommend you to remove the unnecessary third-party scripts or convince the marketing team for better and efficient third-party usage.
Also, most of the third-party scripts do not affect the content of the web page, thus, delaying the downloading, parsing, and executing the third-party scripts until the main content is being downloaded is an important optimization process that can improve the First Contentful Paint, Largest Contentful Paint, First Input Delay, and Speed Index performance metrics. To learn more about Third-party Scripts and Web Page Performance, you may check our related guidelines.
2. Reduce the Size of the Third Party Scripts to Optimize the Total Blocking Time
To optimize the Total Blocking Time, the size of the Third-Party Scripts should be decreased as their count. To decrease the size of the third party scripts, you may open a request to the third-party scripts’ owners. For instance, I have opened a simple request for even a reduction of “four unnecessary code characters” like below through twitter.
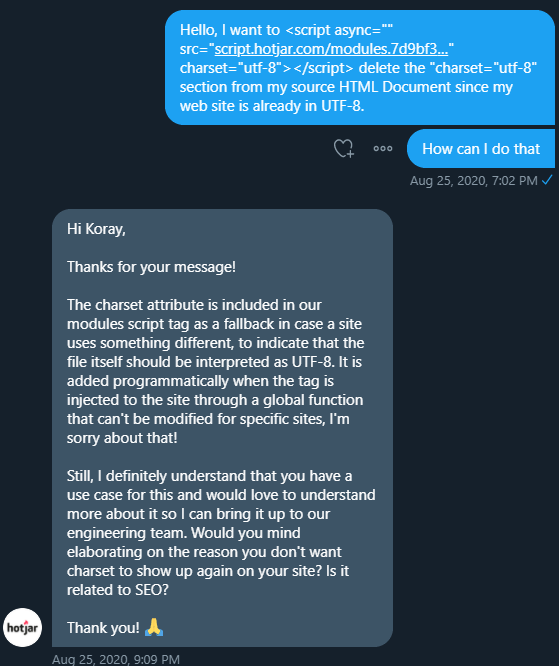
In one of my clients’ websites, the HTML Document has a response header that says that the content is in the “UTF-8” format, this makes the “UTF-8” code snippets in the HTML Documents unnecessary. But since I can’t remove the “UTF-8” block from the “<script async=” src=’script.hotjar.com/modules.7d9bf3…’ charset=’UTF-8′</script>” line, I have contacted with Hotjar and they have opened a new task that says if the web page has already in UTF-8 format, do not include the “UTF-8” addon in the HTML Line for the IT Team.
In this example, these “5 characters” cost only “20 Bytes” but in Holistic SEO and Page Speed Optimization, every code, every pixel, and every letter have importance. For the better user experience and Crawl Efficiency, this mindset is necessary.
3. Minimize the Browser’s Main Thread’s Work to Optimize Total Blocking Time
Main Thread is the processor of the Browser that can perform the process below for creating the web page.
- Script Evaluation
- Style & Layout
- Rendering
- Parse HTML & CSS
- Script Parsing & Compilation
- Garbage Collection
You may also see how many MS Browser’s Main Thread spend on these tasks in Lighthouse as below.
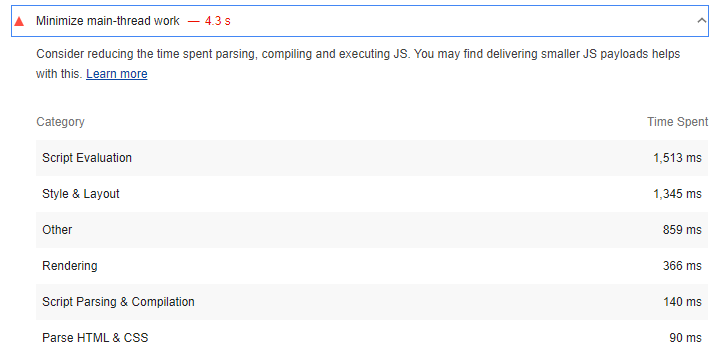
If the main thread is busy longer than 50 MS in a continuous way, this means that some of these Main Thread Work Sections should be optimized. Knowing which section has taken the most time is a good start to know what and how should be optimized. In Chrome DevTools, you may see all of the processes of the main thread in the performance tab as below.

In this example, we see that there are long tasks and non-responsive times to the user while the main thread processes the web page. You may also see the asynchronous loading events and asset loading order to improve. For optimizing Total Blocking Time (TBT) by minimizing the main thread work, you may use the methods below.
- Optimize the Third-party scripts
- Reduce the Main Thread’s work with Web Workers
- Avoid long and complex input handlers
- Reduce the scope of the variables for style calculations
- Avoid layout thrashing
- Minify, Compress and Refactor CSS
- Clean all of the unused Codes
- Defer non-critical CSS and Javascript
- Use code-splitting for reducing the Javascript Payloads
All of these methods can be used for improving the Main Thread’s Efficiency and also optimizing the Total Blocking Time. To learn more about Decreasing the Work for Main Thread, you may check our related guidelines.
4. Decrease the Size of the Web Page Assets’ Size and Request Count to Optimize the Total Blocking Time
Request Size and Transfer Amount are important factors that affect the web page performance in every aspect. In this guideline, we will discuss it in terms of total blocking time. In the Lighthouse’s Diagnostic Sections, you may see that which file type has how many requests and request size as below.
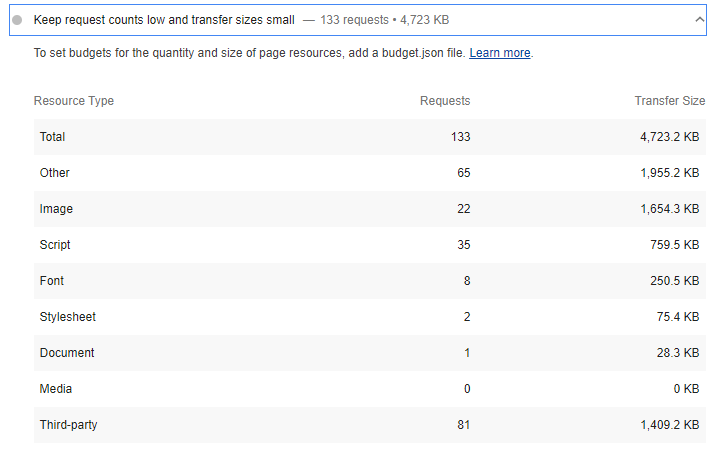
To create a better Total Blocking Time (TBT) performance, smaller file sizes and lesser request amounts are critical. Since the main thread of the browser can download the small files faster with lesser request amount, the possible Total Blocking Time will also be decreased. This situation also will improve the First Input Delay. To decrease the request and transfer amount, you may use the methods below.
- Optimize the Images with better extensions and pixel reducing algorithms.
- Create CSS and Javascript Bundles
- Remove the unused codes according to the different categories.
- Optimize and Compress the Font Files
- Clean the Unnecessary HTML Nodes and Inlined Style and Script Tags
- Turn GIFs into Videos that starts automatically in a loop
- Try to create performance budgets with Lighthouse’s Lightwallet by examining the competitors
To learn more about CSS and Javascript Optimization for page speed and page loading time, you may read the related guidelines from Holisticseo.digital. Implementing these methods will help Total Blocking Time along with other page speed metrics.
5. Importance of Response Time of the Server for Total Blocking Time Optimization
Response time and Time to First Byte (TTFB) is another important subject for the Total Blocking Time. Having a faster server and optimized TTFB will also reduce the TBT. To increase the Server Response Time, you may use the methods below.
- Avoid Using of Dynamic Content
- Configure the Web Server for lesser query
- Optimize the Back-end Infrastructure
- Improve the Server Hardware
- Try to use a CDN Service
- Use Service Workers and Advanced Caching
There are other methods and sections for TTFB Improvements in the context of Total Blocking Time. For instance: if the web site uses server-side rendering, even if the First Contentful Paint happens earlier since the necessary Javascript Functions aren’t being loaded immediately, the user may not interact with the web page yet. While the browser’s main thread loads the necessary functions, Total Blocking Time also creates frustrations, thus having a faster server along with other subjects are important together.
Using the Content Delivery Network (CDN) is also another important aspect of Total Blocking Time. Having a fast CDN around the globe may provide a faster delivery speed since the main web server won’t be overloaded thanks to CDNs, the TTFB can be improved and this affects indirectly the Total Blocking Time per web page asset processing.
To improve Time To First Byte, you may read our related guideline.
Last Thoughts on Total Blocking Time and Holistic SEO and UX
Total Blocking Time is a user-centric performance metric that focused on load responsiveness. If a web page is not responsive during the loading, this situation frustrates the users and create a non-reliable impression related to the Entity’s Reputation in the users’ point of view. Also, Search Engine’s algorithms always care about the User Experience while ranking the web pages in the SERP. If a web page has lots of blocker assets and long tasks for the browser’s main thread, this will impact the crawl budget and efficiency along with the web page’s rankings on the SERP since it can’t response the users properly.
A frozen web page that doesn’t interact with the users create also a trust issue between the brand and the users. It also creates stress during the search on the web. Especially the queries that want a quick answer will have a more Total Blocking Time weight on the rankings. Every search intent creates a new search query and searching behavior pattern, so importance of the different ranking factors has different weights on different queries. Especially the quick answer-seeking queries and e-commerce, calculation and financial search intents need a better Total Blocking Time on the SERP.
A Holistic SEO should always approach in an analytical and critical point of view to all of those ranking factors, user-centric web performance metrics. Our Total Blocking Time guideline will be improved with time.
- Sliding Window - August 12, 2024
- B2P Marketing: How it Works, Benefits, and Strategies - April 26, 2024
- SEO for Casino Websites: A SEO Case Study for the Bet and Gamble Industry - February 5, 2024



That’s really nice post. I appreciate your skills. Thanks for sharing.
Thank you.
Thank you so much! it is ver beneficial.
Thanks for reading.
This is a great piece of content, but can you make a practical video on this topic, so we can understand better?
Thanks in advance!
Thank you, Shweta!
Great article, I have put a lot of effort to improve the result on Page speed Insights, Gtmetrix and Pingdom. Your knowledge is worth every penny invested.
Thank you so much, Nika. We try our best to keep the Holistic SEO focused on SEO innovation for every vertical of SEO, including Page Speed improvements.
Thank you for the article. We now have a Total Blocking Time of 900 milliseconds. Other indicators have already improved and the site loading speed as a whole too. Let’s try to improve TBT according to your article.
I hope it helps.