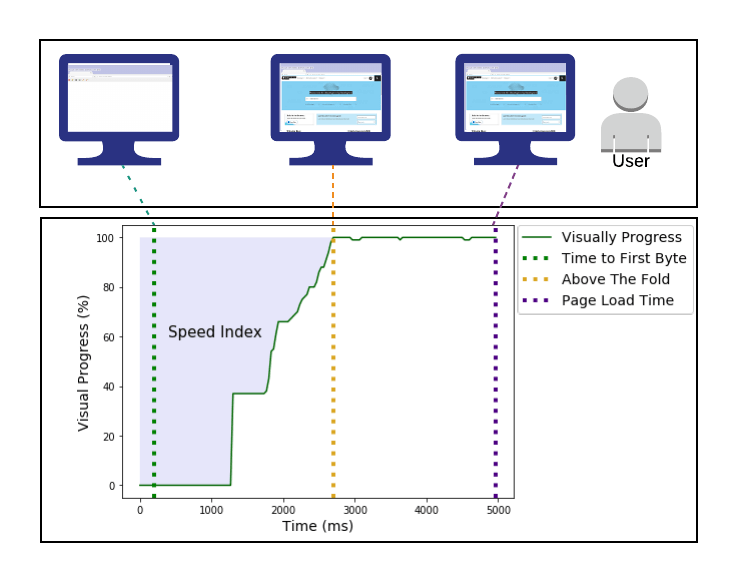
Speed Index is a web page load performance metric that shows how quickly elements of a web page become visible. Speed Index (SI) is measured only on the visible portion of the screen. The visible part of the screen, above the head section, affects the Speed Index score with visual progress and visual completeness speed of web page contents. Different viewport sizes will produce different Speed Index scores. Speed Index has been introduced by Webpagetest in 2012. And, for the importance of Speed Index along with its measurement and optimization methodologies, lots of different approaches exist. Speed Index is also related to the “Perception of Page Speed” along with the “Actual Page Speed“.
An improved speed index score means that a website communicates visually faster with the user and gives the user a faster opportunity to achieve the purpose of the visit. Speed Index is not a web page load performance measure in Core Web Vitals. However, Speed Index is one of the important indicators showing how efficiently a web page is loaded for the user.
Therefore, there is an important link between Search Intent and Speed Index. If a user’s Search Intent “requires a fast action”, the importance of the Speed Index will increase even more for both UX and SEO.
Which Web Page Loading Performance Metrics Are Related to the Speed Index?
All web page loading performance metrics are linked. While a website has a bad Time to First Byte, it cannot have a good Speed Index. Or if a website has a good Largest Contentful Paint, the Speed Index Score is likely to be good too. All web page performance metrics affect each other. Therefore, when considering Core Web Vitals and other web page performance metrics, the link between them must be known. The metrics most relevant to Speed Index are First Contentful Paint, Largest Contentful Paint, as Speed Index is measured directly in the field in the “viewport”. Other than that, the most relevant metric for the other Speed Index is Time to First Byte. It is impossible for the top of a web page to have a fast image completion speed if your server is handling every request slowly.
Web Page Performance Metrics related to Speed Index are listed below for reasons.
- First Paint
- First Contentful Paint
- Largest Contentful Paint
- Time to First Byte
First Paint (FP), First Contentful Paint (FCP), and Largest Contentful Paint (LCP) are directly related to the Speed Index because they are being calculated within the Speed Index (SI)’s measurement as “frames” or “paint events”. First Paint means the first paint event of a web page with the first pixel painted, while First Contentful Paint means the first “meaningful painting”. They are intertwined with the Speed Index concept as both affect the visual completion of the content at the top of the page.
Time to First Byte should be taken into account in the Speed Index Score calculation as it directly affects the loading speed of all resources to be used in the Speed Index Score calculation as Paint Event and “Video Frames”.
Web Page Performance Metrics that are not directly related to the Speed Index is listed below.
- Total Blocking Time
- First Input Delay
- First Idle Time
Total Blocking Time (TBT), First Input Delay (FID), First Idle (FI) web page loading performance metrics more related to user-experience and “load-responsiveness”. Since Speed Index is related to “perceptional speed”, it is not in the same category as “TBT, FID and FI” times.
Why is Speed Index Important for SEO and UX?
Speed Index is about looking at the loading event of a web page through the eyes of the user rather than handling a web page only with browser events. For this reason, it is one of the straightforward user-centric performance metrics of the Speed Index. User-centric Page Speed or web page loading performance metrics are metrics used to directly understand the user’s experience of web page loading.
SEO and User Experience are concepts that are directly related to each other. When a web page that offers a bad user experience is seen by the Search Engine because it fails to match Search Intent, it will be dropped in rankings. For this reason, a good Speed Index Score indicates better and faster communication with the user visually. A better User Experience is necessary for a better Search Engine Optimization Performance.
Navigation Timing API is an application that has been used to measure the speed and performance of a website for a long time. Navigation Timing API offers more consistent metrics than most Javascript-based tools.
Navigation Timing API is an application that works with “Real-world Data” ie “Real User Metrics (RUM)”. For this reason, it is more valuable than tools that measure web page loading speed with “Lab Data”. Navigation Timing API uses different elements such as “window.performance”, “window.performance.timing”, “window.performance.timing.navigationStart”. Although “Window.performance” is an element used by the High-Resolution Time API, “Navigation Timing API” has added two separate elements such as “timing” and “navigation”, allowing difficult-to-measure website speed metrics to be measured with real user data.
Navigation Timing API works with XMLHttpRequest in the user’s browser, transmitting the user’s experience to the server.
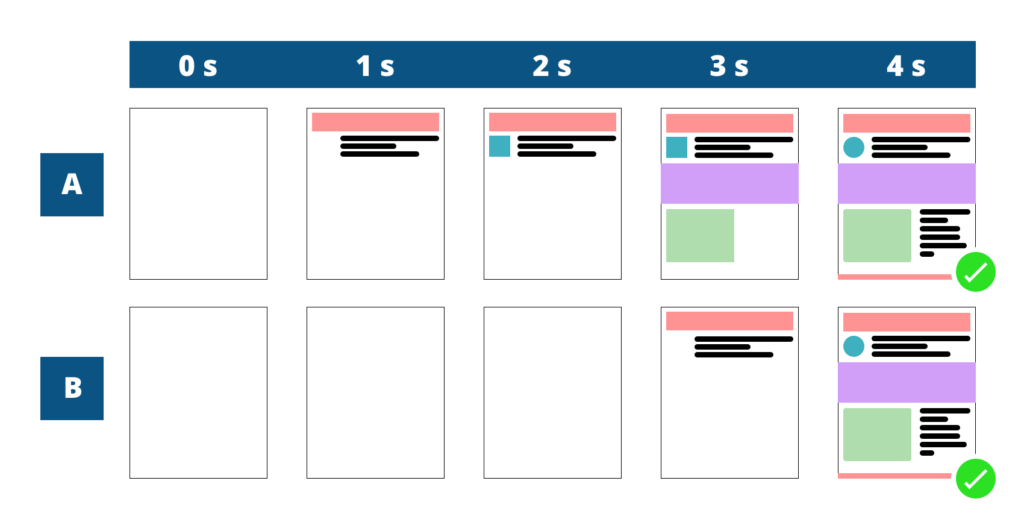
So, what is the relationship between Speed Index and Navigation Timing API? Navigation Timing API cannot measure “visual completion and visual completion speed” in any way. It only indicates that certain web page loading events are completed at a certain time. However, it cannot show the visual function of a “web page performance measurement event” completed in the 3rd second on the web page.
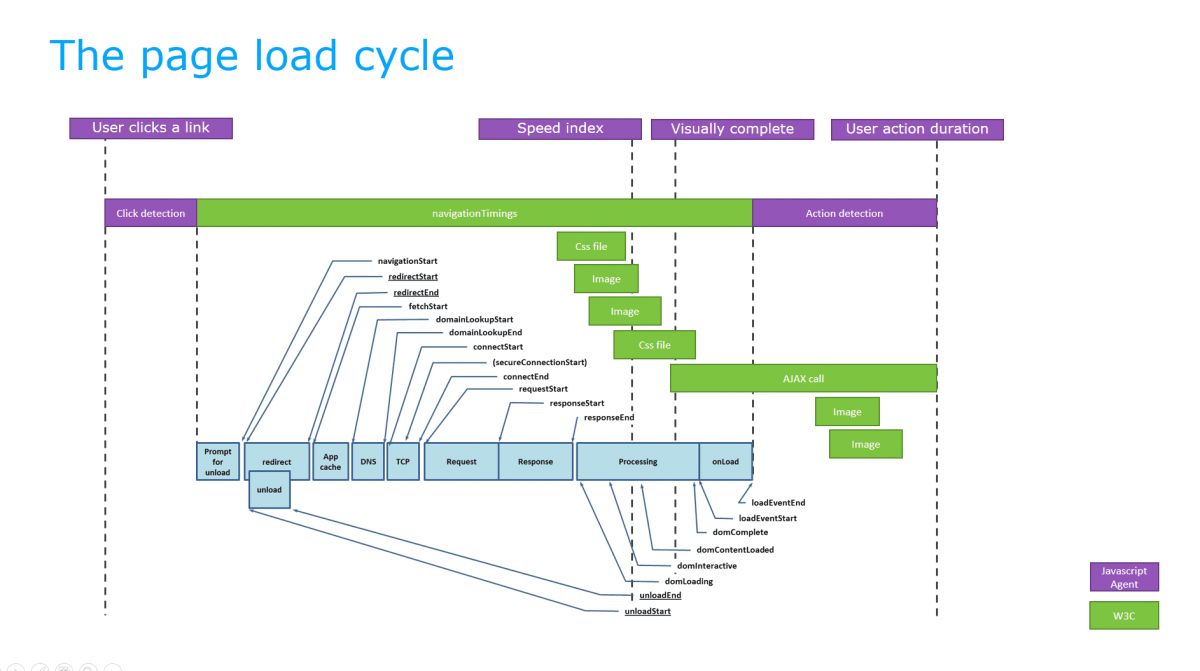
In this context, the Speed Index is a resource that complements the lack of Navigation Timing API’s visual load time measurement point. Speed Index is also at the point of “perceptional web page loading timing” and is at an important point in SEO, UX, and Web Development. To measure the Speed Index, the “Speedline Node.js Module” has been started to use by developers so that Speed Index Measurement can be performed.
Who Improved the Speed Index Term and Measurement Method?
Webpagetest.org found the Speed Index Web Page Loading Performance Metric. Webpagetest.org believes that each web page velocity metric only measures a single point, so it will only represent a value if taken together. Since Speed Index measures the visual completion speed of the content in the above fold section, it refers to the combination of many speed metrics. According to Webpagetest.org, Speed Index is a web page speed measurement metric that shows how the “onload” event on two separate web pages has different values for the user’s page loading experience.
How is Speed Index Measured?
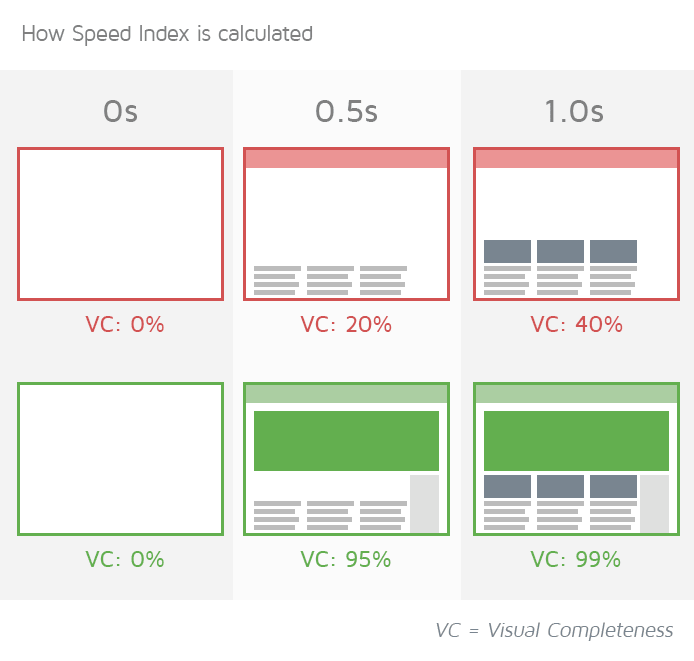
While the Speed Index is measured, the content in the visible part of a web page’s screen is recorded in frames 10 times every 1 second during the page loading. The difference between each record taken while loading the page, that is, the differences between frames, is looked at the point of the content loading speed in perception.
The “complete” ratio is calculated as a percentage by comparing the difference between each frame recorded while the page is loading and the last frame taken after the web page is loaded. The Complete Ratio for the different frames is also an indicator of the Speed Index Score.
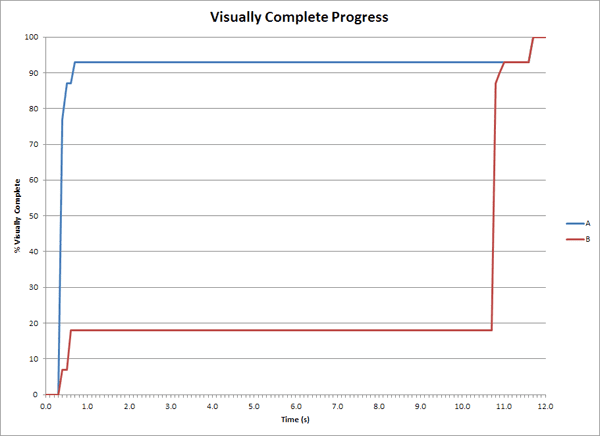
While measuring the Speed Index Score, Visual Completeness is shown in a line-plot throughout the load time. Visual Completeness Percentage is processed and placed on the graph by looking at the differences between the frames recorded for each moment during the web page loading. Visual Completeness Rate is in Y-Axis, Load Time is in X-Axis. At this point, when two separate websites are compared, the speed of Visual Completeness is found, and Visual Completeness Speed is the Speed Index.
Visual Completeness Curve in the Plot-line For Calculating the Speed Index
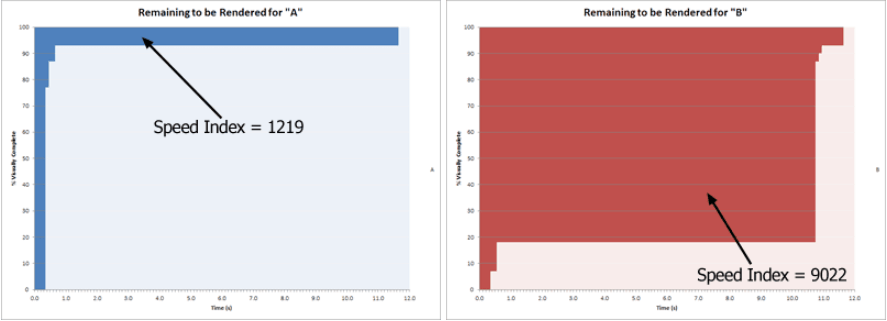
For Speed Index Measurement, the area below and above the Visual Completeness line can also be calculated. The curve in the graph, the area below and above the Visual Completeness Ratio, can give the Speed Index Score. To measure the Speed Index Score, the area above the Visual Completeness Curve should be taken as a basis. The reason for this is that a web page can continue to consistently complete its content within the above the fold section. A website that achieves as much Visual Completeness as possible for 10 seconds by pushing a splash screen or uploaded content down can achieve a level of Speed Index Score that normally shouldn’t be.
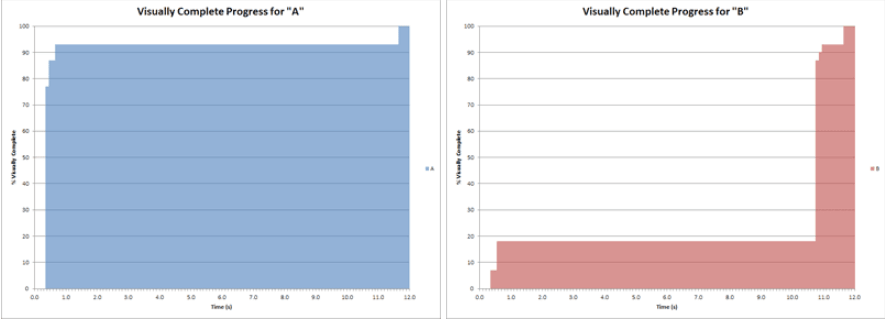
Looking at the top of the Visual Completeness Curve, you can see the area where “Visual Completeness” has not been achieved. The area that is not visually completed will show the Speed Index Score more accurately. Thus, the fact that a website spins for 10 seconds and loads its content at once will prevent it from obtaining a more Speed Index Score.
Why Doesn’t Pixel Matching Work for Visual Progress Measuring?
Pixel Matching is a solution for visual completeness progress measurement. The similarity ratio is extracted by comparing the pixels between two separate frames. With the ratio of the matching pixels from the two different frames, the visual completeness progress’ speed is assumed to be fast or slow. However, Pixel Matching is not sufficient for Speed Index measurement. Just changing the position of a web page element by 1 pixel by pushing other web page elements up, down or right, or left means that all the remaining pixels also change.
Even in the simplest layout changes, changing the values of all pixels between two frames will bring the Speed Index measurement to 100% Visual Progress in any case. Because Pixel-comparison and Pixel-matching methods do not work, the “color-comparison” method has been applied in Speed Index measurement.
How Does Color-Comparison Between Frames Help for Speed Index Measurement?
With the color-comparison method, the first frame and the last frame during the loading of the content in the above the fold section of a web page are accepted as the base comparison point. By comparing the colors in the first frame and the colors in the last frame, the Speed Index Score is calculated by looking at which one of the frames in between is more similar to which base point.
What is the Problem of Color Comparison Method in Speed Index Measurement?
In Speed Index measurement, there are some problems with the Color-comparison method. For example, when an animation or video background is used in the above the fold section, there is a situation where the colors change continuously. For this reason, the Color-comparison method can actually interpret a web page element that has already been loaded and communicated with the user as an element of the web page that changes as it is loaded.
When video or animation is used, the Speed Index measurement is based on the last frame of the video or animation. In order for the last frame taken as a basis to be used better for Speed Index measurement, the Paint Events of the Browser are used.
How Does Paint Events Help for Measuring Speed Index?
Since Webpagetest thinks that paint events will be useful for Speed Index measurement, it has started to analyze paint events by using DevTools of Webkit-based browsers. Since it offers a very fast solution, there is no need to record videos.
Below you can find information on how to paint events are captured using DevTools and used for Speed Index Measurement.
- Collecting the all useful paint events and other events from the web page loading timeline.
- Collecting all the paint events before the first layout event that happens after the Time to First Byte.
- Grouping the Paint Events according to their effects and affected HTML Node’s ids and classes.
- Grouping the Paint events according to the affected element’s height and width.
- Every rectangle that has been painted calculated according to its size (width and height).
- The largest paint event can happen for the “full-screen” paint events.
- Every paint event according to their effect’s size changes the Speed Index score.
- Every full-screen paint events’ score has been calculated with their 50% effect so that they don’t dominate the calculation progress.
- Every point for a rectangle has been divided according to the total amount of paint event for that rectangle.
- If a rectangle has a single paint event, that event will get all contribution points for that rectangle’s visual progress.
- If a rectangle has 10 paint events, every paint event’s contribution point will be 10%.
- The endTime is the time of that rectangle’s paint event’s occurrence time.
- Each paint event for each rectangle is calculated for visual progress measurement within the total of all rectangles and their paint events along with their timings for the viewport.
- Every Speed Index measurement is affected by the size of the viewport. For a wider screen, the Speed Index measurement will have more paint events and rectangles while for a narrower screen it has fewer rectangles and paint events.

How Does Lighthouse Measure Speed Index?
The Speed Index is measured by Lighthouse according to the visual progress speed of the content in the viewport. Lighthouse uses the traditional method for measuring the Speed Index by using capturing a video and measuring the similarity level between frames. To calculate the similarity level of the different frames of the video that shows the visual progress of the web page’s content during the loading, Lighthouse uses the “Speedline Node.js Module.” And, Speedline Node.js Module has been used for measurement of the Speed Index score via “Histograms”. Speedline Node.js Module has also been improved for taking place of the Navigation Timing API for the Speed Index measurement.
The main difference here is that Lighthouse doesn’t use the distance between histograms for measurement of the Speed Index, Lighthouse uses the Structural Similarity Index Measure for Speed Index measurement.
For the calculation of the Speed Index by Lighthouse, the Structural Similarity Index Measure (SSIM) has been used. SSIM is the methodology for calculating the similarity level of two different frames from the same video so that the video’s quality can be understood. In the beginning, Structural Similarity has been used for determining the quality of the televisions.
Lighthouse calculates the speed index score based on HTTP Archive data. If the Speed Index score of a web page is better than the average of the Speed Index Score of the websites in HTTP Archive, the result is considered good.
What is the Good Score for Speed Index according to the Lighthouse?
A good Speed Index Score must be under 4.3 seconds, according to Lighthouse. The average Speed Index Score is between 4.4 and 5.8 seconds. A speed index above 5.8 seconds is considered bad. All of the data here is calculated by Lighthouse according to HTTP Archive Standards. If the HTTP Archive’s data changes, the good, medium, and bad Speed Index Score thresholds for Lighthouse will also change.
Below, you will see Lighthouse’s Speed Index thresholds in a table.
| Speed Index Timing | Color Code for Speed Index Score | Speed Index score |
|---|---|---|
| Between 0 and 4.3 Seconds | Green (Fast Speed Index) | Between 75 and 100 |
| Between 4.4 and 5.8 Seconds | Orange (Moderate Speed Index) | Between 50 and 74 |
| Over 5.8 Seconds | Red (Slow Speed Index) | Between 0 and 49 |
How to Optimize Speed Index for a Web Site?
There are two ways to improve the Speed Index. Some of these methods are related to Progressive Rendering, others are related to Resource Load Order Optimization and Resource Compression. Pagespeed methods that can be applied to improve Speed Index Score are listed below.
- Uploading Off-screen Images with Lazyload.
- Adding placeholders for images.
- Using new-generation visual extensions.
- Cleaning up dead and unused codes.
- Compressing CSS and Javascript along with other the resources required for the web page.
- Reducing the number of requests by combining the CSS and Javascript files.
- Creating a cache hierarchy and strategy for web page resources.
- Optimizing image files as lossless or lossy according to the user-preferences.
- Postponing the download of third-party tracker resources with deferring.
- Compressing, combining, and optimizing font files.
- Refactoring CSS and JS Files.
- Improving the Server’s Conditions for faster delivery and response times.
- Using CDN for faster delivering the web page resources.
- Decreasing the DOM Size of the HTML Structure so that the DOMContentLoaded Event can happen faster.
- Preloading the Key Requests of the Web Page.
- Using Shadow DOM for making the above the fold section is the main priority.
- Using Virtual DOM for smoother page transitions.
- Using Brotli, Gzip, and Deflate as the compression infrastructure at the server-side.
- Using Pre-rendering for the web pages.
- Using Server-side Rendering for the web pages.
- Using “content-visibility:auto” CSS for Delaying Off-screen Web Page Element’s Rendering
There are more methods for improving Speed Index.
An important part of the methods conveyed here can be used to improve the page speed metrics associated with speed index together with speed index.
In this context, the Page Speed improvement topics here will be covered largely by Speed Index. If you want to learn how it affects other page speed metrics, you should read Holisticseo.digital’s Page Speed Guideline articles.
1. Using Lazyload for Deferring Off-screen Images to Improve Speed Index
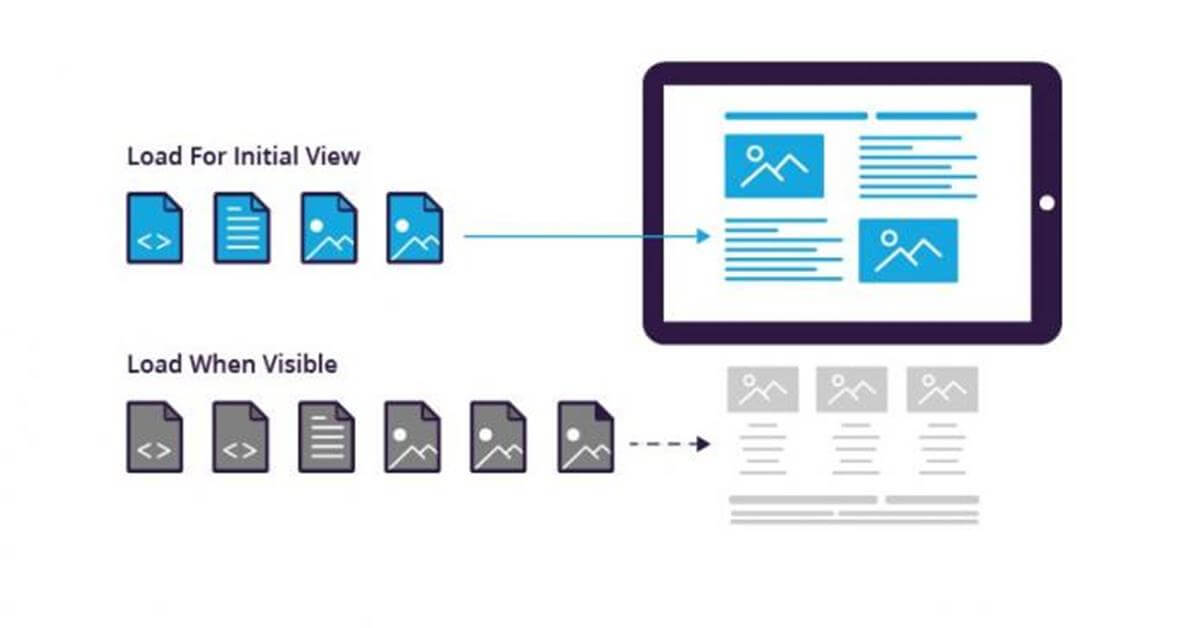
Lazyload is a method of optimizing a page load for the user, which is used to delay the loading of images outside the viewport. Since LazyLoad delays loading images that are not in the viewport, each image in the above the fold section loads faster for the user. Thus, Lazyload improves the Speed Index Score.
Using the Intersection Observer API for lazyloading is better than any third-party or browser-based lazyload method. The first reason for this is that when you perform lazyload with Intersection Observer API, you will eliminate the browser-compatibility problem. However, most of the developers nowadays prefer the “Lazyload” browser hint as it is easier. Lazyload Browser Hint is mainly supported by Google Chrome and Chromium-based browsers. Thus, if you use Lazyload via Chrome’s browser hint “lazyload”, you should also pay attention to the users that don’t use Google Chrome since they won’t be able to benefit from the LazyLoad methodology that is based on browser hint. Below, you will see which browsers support the LazyLoad Browser Hint.
For Lazyload on a WordPress site, you can use the plugins below.
- Native Lazy Load Plugin
- Lite Speed Plugin
- WP Rocket Plugin
- WP Fastest Cache Plugin
The LazyLoad method should not be used to load images in the above the fold section. Because, if you use LazyLoad on an image that is in the above the fold section, the image won’t be able to be downloaded before the LazyLoad script and event-triggered, thus only the off-screen images should be downloaded via Lazyload.
2. Adding Placeholders for Images to Improve Speed Index
Placeholders are representative images in the image area before an image is fully loaded. Since placeholder images are of much lower size, it increases the speed of communication with the user during the web page loading. Placeholders that improve Perceptional Speed by increasing the speed of visual completion are important for improving the Speed Index score.
Placeholder Image Generator services, various Javascript Packages are available for creating Placeholder Images. Using the placeholder also works in situations where the Largest Contentful Paint is an image.

3. Using Progressive Image Extensions to Improve Speed Index
Image Extensions affect the size and quality of an image according to its intended use. While the quality of an image remains the same, its size can be significantly reduced according to Image Extensions. Therefore, it is useful to be familiar with image extensions such as Avif and WebP. Today, the best image extension for web page loading performance metrics is “Avif”. However, since Avif is still not supported by many browsers, it is useful to use new HTML tags such as “picture” and “srcset”.
You can put the most efficient image extension at the top with “srcset”, then put the less efficient one lower. Thus, the Speed Index score will be improved according to the capabilities of the browser, considering the image extension it supports.
4. Cleaning Unused Codes from the Web Pages to Improve Speed Index
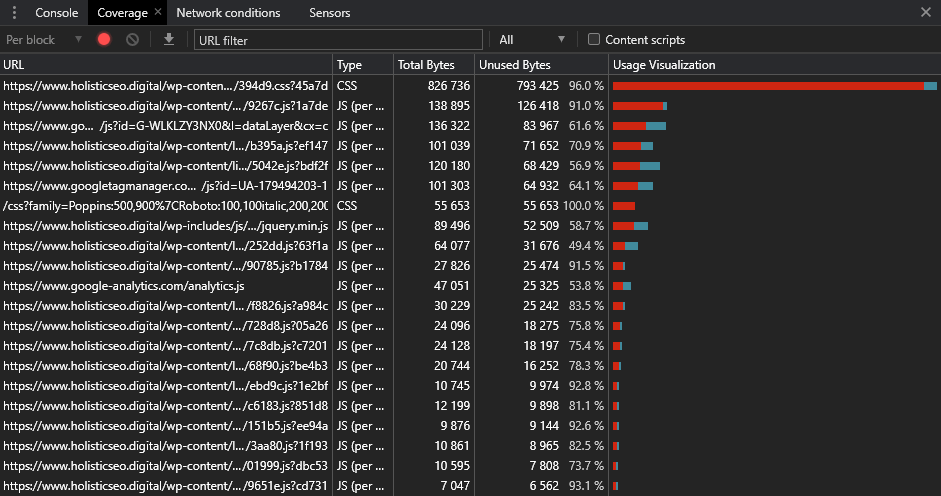
Unused codes increase the size of a web page. Unused codes are one of the rare web page loading performance-related elements that are harmful to all speed metrics. Any unused lines of code negatively affect all speed metrics and web page activity, from First Paint to Onload Event. That’s why it’s important to free a web page of unused code to create a quick visual completion with a good Speed Index Score.
You can see the unused codes through Google Chrome’s DevTools as follows.
There are also a variety of Node Modules available to find and clear unused code along with other web development libraries such as…
5. Compressing and Minfying the Javascript and CSS Files to Improve Speed Index
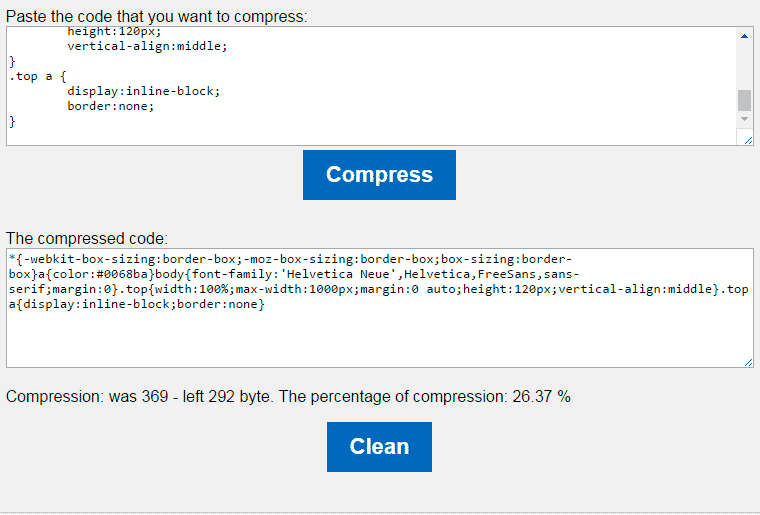
Compressing and Minifying are implemented to reduce the size of HTML, CSS, and JS files. HTML, CSS, and JS files of a web document may contain various whitespace, comments, and unnecessarily long blocks of code.
By clearing, compressing, and shrinking all these code blocks, a web page and its resources can be shrunk by more than 30%. Compressing and Minifying is one of the applications that will reduce the negative impact of the size of HTML, CSS, and JS files on the Speed Index Score.
6. Reducing the Request Size by Bundling CSS and JavaScript Files to Improve Speed Index
Request Size is one of the factors that affect Speed Index and other web page performance metrics. Due to the excess of Request Amount, when the browser starts to render the content at the top of the page, it starts loading other content, DNS Resolution, Stalled, Queuing and TTFB time for each resource negatively affects the Speed Index.
Therefore, by reducing Request Amount, Speed Index gets to a better point with visually fast completion of content within the viewport. To reduce the request Amount, the number of requests required for image, font, CSS, and JS files should be reduced. CSS, JS, and some Image files can be combined to reduce the number of requests. Thus, it will be possible to load the same page resources with fewer requests.
7. Creating a Cache Hierarchy and Strategy for Web Pages to Improve Speed Index
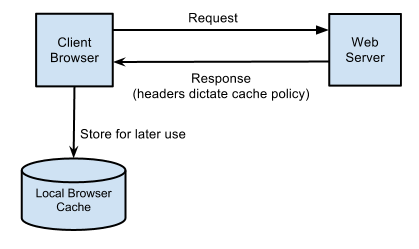
HTTP Cache Hierarchy is the hierarchy between browser’s internal cache system elements such as “Push Cache”, “Preload Cache”, or “Service Worker”. And all of those cache system elements are connected to each other within a hierarchy so that a file may not be called again despite it is in one of those cache layers.
And, using a cache strategy is important so that a file can be called with the best possible cache kind. Some resources should be used via Server’s PUSH and some of them should be used via Service Worker’s Cache. The speed Index score is affected by the browser and server cache systems since it relies on the resources’ fast delivery time. If a resource is not in the cache, because of the high Time to First Byte Score, the Speed Index score will also be affected negatively.
To understand HTTP Cache Hierarchy better, you can read our “Specify Vary: Accept-encoding Header” guideline.
8. Optimizing the Image Files to Improve Speed Index
Image Files can be optimized in terms of size by reducing the pixels and the metadata they contain. Image optimization is divided into lossy and lossless. Each optimization type should be chosen based on the image’s location and role on the web page. Metadata is information in text formats such as the IPTC code of an image, the region where the image was taken, the camera it was taken, and the date it was taken. Reducing the number of pixels in images without sacrificing quality and removing unnecessary image metadata reduces the size of an image. Each image reduced in size contributes to the speed of the web page, so the Speed Index score gets better with images that load faster.

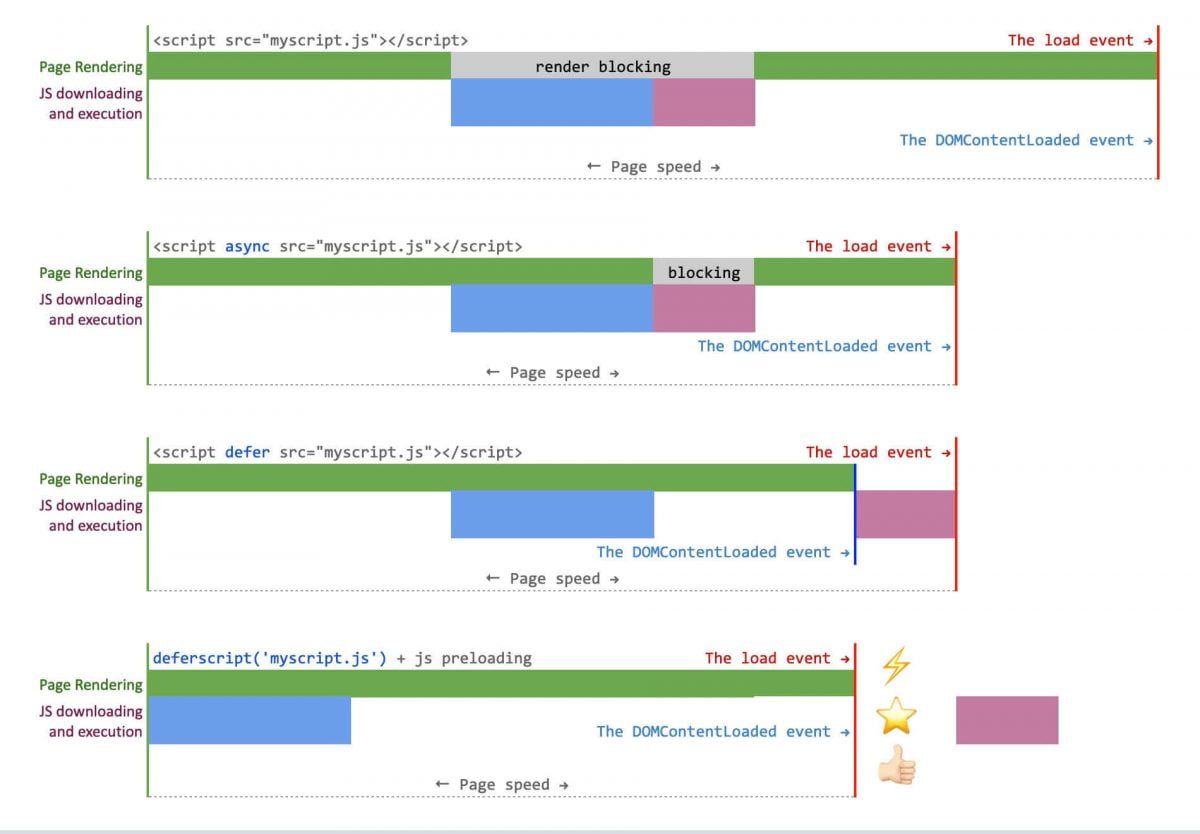
9. Deferring the Third-party Javascript Trackers to Improve Speed Index
Third-party trackers are javascript files that are not related to content and are used to measure user behavior. Third-party trackers should not slow down the loading of the content a user wants to see or prevent the page from fulfilling its purpose, as it is not related to the user’s purpose of visit.
Speed Index is the speed at which the content in the viewport is visually completed, while it is directly related to the loading speed of the same content. Therefore, third-party javascript trackers, such as Google Tag Manager Script, Google Analytics Script, or Adobe Analytics Script, should be prevented from loading the actual content.
10. Optimizing the Fonts to Improve Speed Index
Fonts are files that affect the formatting of text and the number of characters on a web page. The size, number, extension, and loading priority of font files directly affect Speed Index. The use of fewer and smaller fonts on a web page, and the use of font file extensions that provide better compression, such as woff2, directly affect Speed Index.
Especially in the Above the Fold section, since most websites contain text and the related text element is affected by the loading of font files, font files are of direct importance for Speed Index. Font files contact different web page loadings performance metrics such as FOIT (Flash of Invisible Text) and Cumulative Layout Shifting.

11. Refactoring the Javascript and CSS Files to Improve Speed Index
Refactoring CSS and Javascript means that improving the efficiency of the JS and Cascading Style Sheet files by decreasing the size of the JS and CSS files while organizing the code lines. In Javascript, the variable chains are important along with variable amount and functions’ hierarchy. In CSS, unnecessary classes, ids, and values should be united and cleaned from the CSS files with refactoring.
12. Improving the Server Infrastructure to Improve Speed Index
Improving Server Infrastructure is an important factor in improving the speed index score. While creating a web page, using fewer queries and event chains on the server-side and caching existing events and queries provide faster rendering of the upper part of the web page.
Below are things that can be done to speed up Speed Index by improving the server infrastructure.
- Run fewer queries on the server-side.
- Caching server-side queries.
- Updating the server’s hardware
- Improving the hardware features of the server such as RAM, CPU
- Keep the number of Response Headers as required
- Increase the server’s internet connection speed
- Use CDN to provide faster connection performance for the users
13. Using CDN to Improve Speed Index
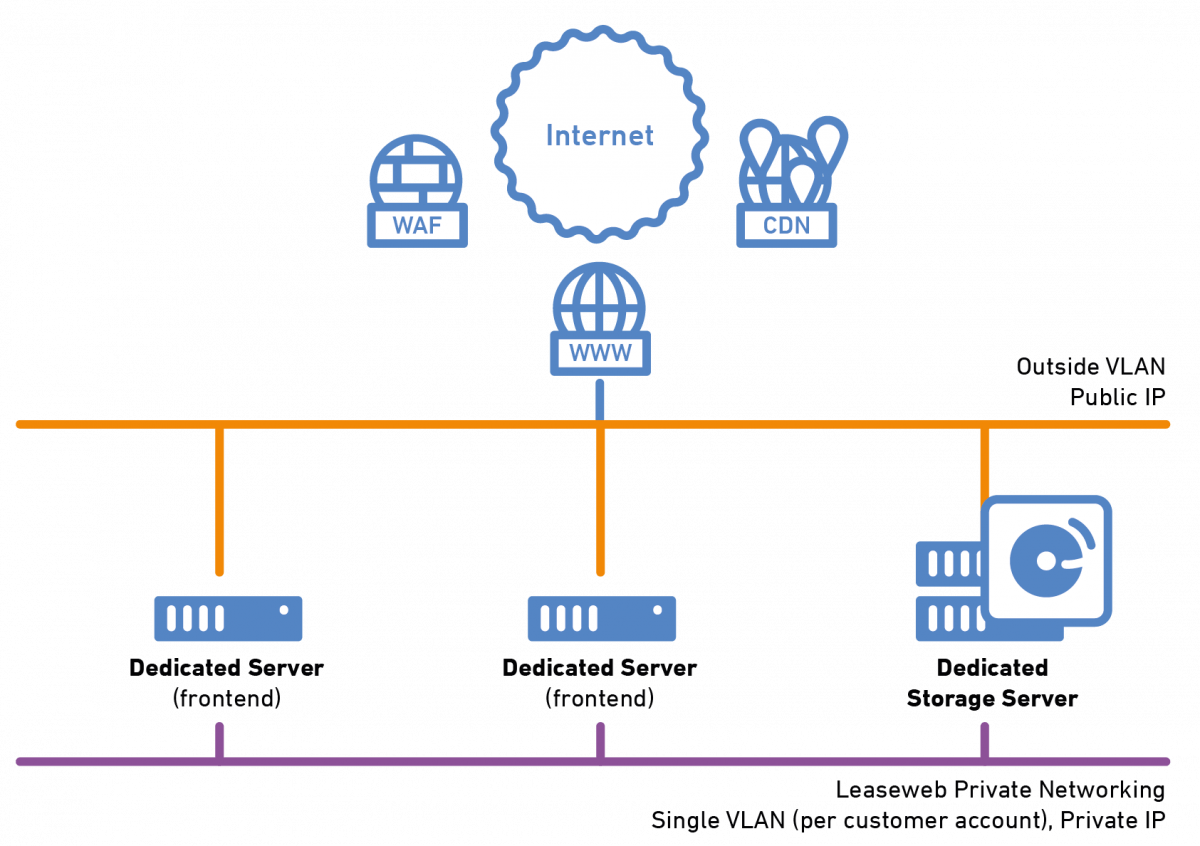
Content Delivery Network (CDN) is a technology that enables a website to download resources such as CSS, JavaScript, Font, Images from the closest point to the user in different parts of the world. Thus, the Time to First Byte duration is decreasing for users all over the world. As some of the resources required for users to use the website are transferred to different servers, the load on the main server of the website is thus reduced. The speed Index score is improved by users downloading the resources used by web pages such as JS, CSS, Font, Images faster thanks to CDN.
To learn more about the Content Delivery Network (CDN) and see how it affects website speed improvement, you can read our related guide post.

14. Preloading the Key Requests to Improve Speed Index
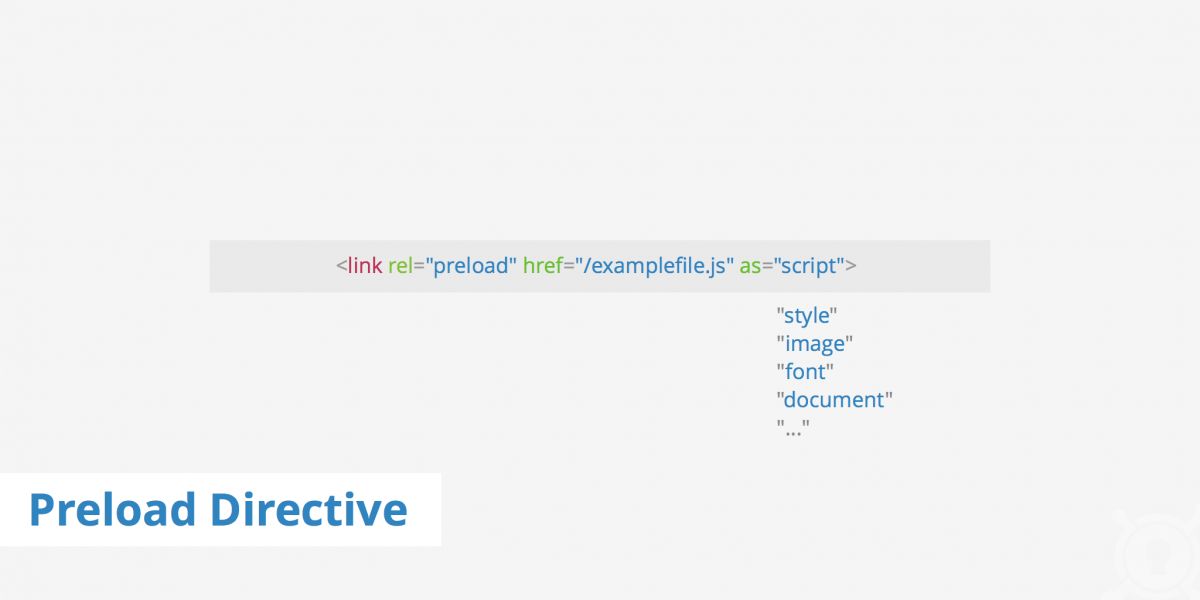
Preload is a browser hint that enables important resources used on the web page to be loaded earlier for the user. Preload ensures that early loaded resources are also cached. However, the preload should be used specifically for sources that affect the First Paint, First Contentful Paint, and Largest Contentful Paint metrics. With the correct preloading of the right resources, the Speed Index score will be improved, as the visual elements in the above, the fold section of the web page will load faster.
If you preload too many resources, you will probably put the Browser’s Main Thread into the bottleneck, as all of the related resources will take precedence during loading. Therefore, of the CSS, JS, Images, and Font resources, the most essential should be preloaded for Speed Index improvement.
15. Using Server-side Rendering to Improve Speed Index
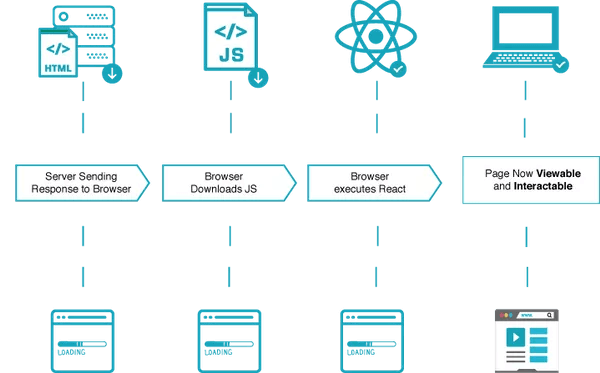
Using Server-side Rendering is another method to improve the Speed Index (SI) Score. Server-side rendering is a method for rendering the web page on the server-side so that the users’ browser and device do not spend time on this task. Thanks to server-side rendering, a web page can be delivered faster. But, it also has some side-effects. Since, the rendering of the web page on the server-side will take time, until the process ends, the user can’t see the actual content. That’s why using a server-side cache for the server-side rendering is useful along with using a pre-rendering technology.
If Server-side Rendering is used without a server-side cache technology, such as Varnish, the user will see a blank page until the server-side rendering is finished for the corresponding web page. At the same time, server-side rendering will overhead the server without a server-side caching technology like Varnish. Therefore, Server Side Rendering (SSR) must be used with a server-side caching technology to improve the Speed Index Score.
16. Using Pre-rendering to Improve Speed Index
Pre-rendering is a feature between Server-side Rendering (SSR) and Client-Side Rendering (CSR). Client-Side Rendering means the creation of a web page in the user’s browser, on his device. Server-Side Rendering is the creation of the web page by the server and sending it to the user’s browser and device from the server as ready.
Pre-rendering is a method between Server Side Rendering and Client-side Rendering. The “skeleton” version or the initial version of the web page is presented to the user in the pre-rendered form. After the other resources required to load the web page from the server are loaded by the user, the “skeleton” design disappears and the actual content of the web page is displayed.
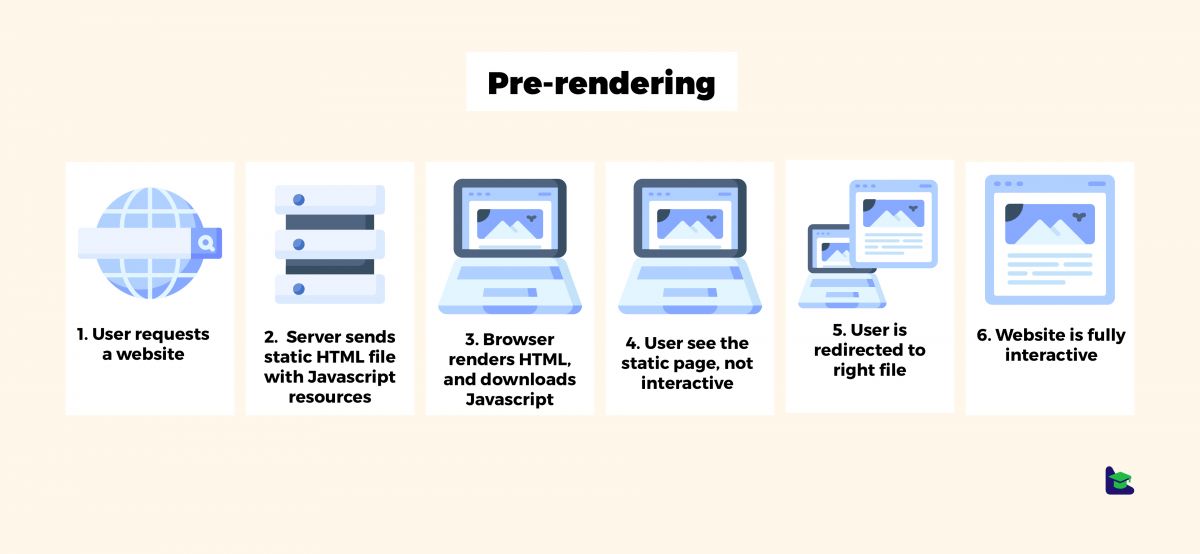
Thus, the Speed Index Score is improved. You can think of “pre-rendering” as “placeholders” used for fast loading of some kind of images. Speed Index is the speed at which the top part of a web page is visually completed, with pre-rendering a representation of the content in the upper part of the web page is loaded, then “visual completion speed is increased” as the actual content is loaded.
17. Using Brotli, Gzip or Deflate for Server-side Compressing of Files to Improve Speed Index
Gzip, deflate and brotli are compress technologies that enable the server to compress the resources to the user and send them in smaller sizes. Brotli is a technology that provides 36% more compression than Gzip. Brotli was developed by Google. Therefore, the use of “brotli” can provide further compression of the files required for the web page on the server-side. All resources sent from the server in a compressed form are re-uncompressed with the browser by the user’s device and entered into parse, compile, execute processes. Speed Index Score will be improved as the compressed resources on the server will be delivered to the user faster.
It is not difficult for a user’s browser and device to parse, compile and execute the resources of the relevant web page, but to download the necessary resources from the server where the web page is located. For this reason, especially the time required to connect to the server and the speed at which the server sends relevant resources to the user are the most important page speed and Speed Index Score factors.
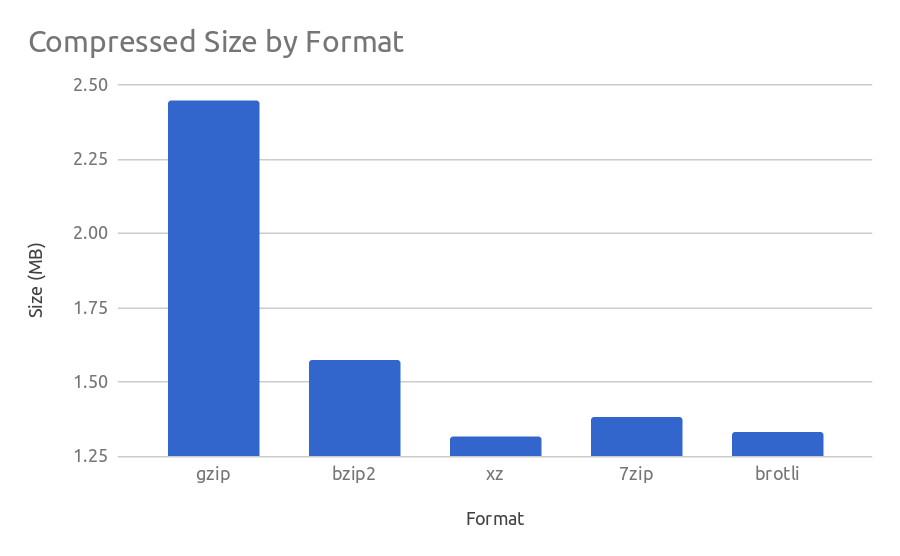
Note: Server-side Compressing should not be applied to image files.
18. Using Shadow DOM to Improve Speed Index
Shadow DOM is a second DOM Tree in the Document Object Model. Shadow DOM is loaded by triggering under certain conditions, thus allowing the space inside the Shadow DOM to be displayed to the user faster. With Shadow DOM, the upper part of the web page that affects the Speed Index Score can be loaded faster, while the rest of the web page can be taken into Shadow DOM and rendered only after the upper part is loaded.
Since the loading of the top of the web page is prioritized, Shadow DOM when properly implemented improves the Speed Index Score significantly. Since Shadow DOM is a Javascript-based application, Shadow DOM should be put after other options in the web page performance loading strategy to keep the website’s crawl cost and Javascript dependency at a lower level.
19. Using Virtual DOM to Improve Speed Index
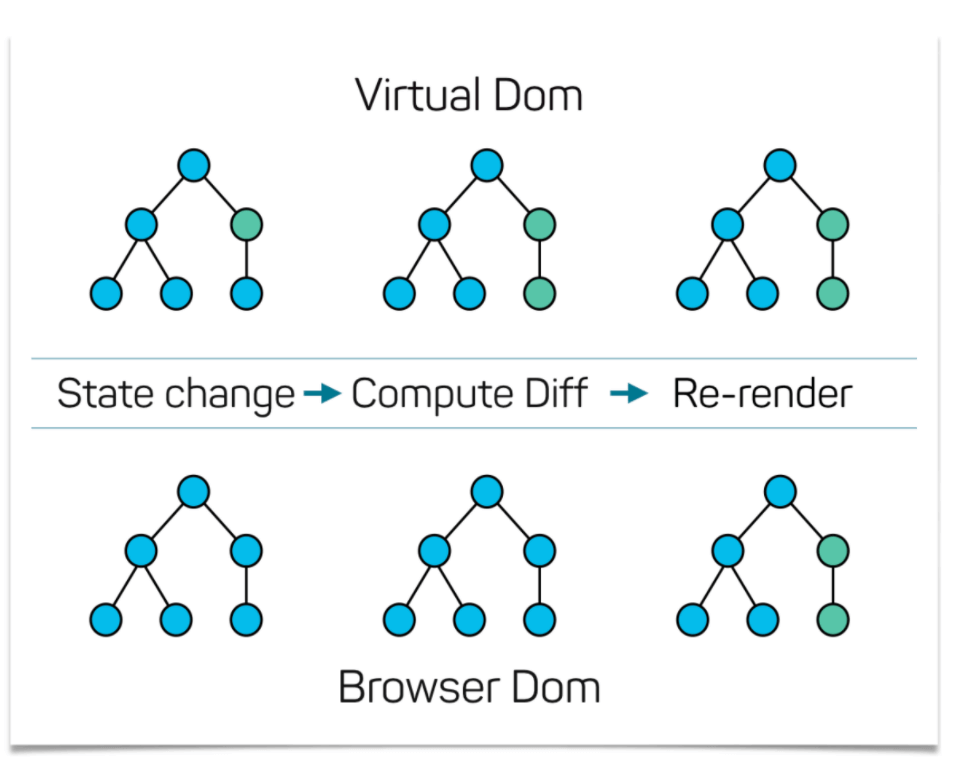
The Virtual DOM is the DOM Type that allows loading only the different areas between the first web page and the second web page, rather than completely reloading the web page when moving from one web page to another.
While the Virtual DOM provides an important contribution to Conversion Rate Optimization, User Experience, Search Engine Optimization, it also provides easier browsing of the web page by Search Engine Crawlers by significantly reducing the cost of scanning. The virtual DOM also reduces the load on the server as fewer resources are requested from the server each time a new web page is opened.
20. Decreasing the DOM Size to Improve Speed Index
Document Object Model (DOM) Size is determined by the number of HTML Node a web page has. Each HTML Node affects the time it takes for DomContentLoaded Event to occur. As the DOM Size increases, the processes required to render the web page by the browser such as Layout, Composite, Style, Reflow start to take more time. Therefore, an Excessive Amount of DOM Size causes a web page to slow down. After DOMContentLoaded and CSSOM Events, the web page starts to be created after the Rendering Path is determined. By reducing the DOM Size, the Speed Index Score is improved as the visual completion speed of the page will increase.
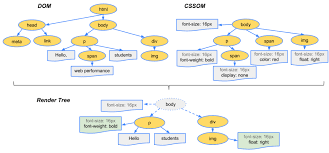
According to Google, a web page should have less than 900 HTML Node, Document Object Model (DOM) Size.
21. Use Content-visibility: Auto for Delaying the Off-page Element’s Rendering
Content Visibility Auto is a newly released CSS Property and Value by Google Chrome Developers. With Content Visibility Auto, only the specified and prioritized part of a web page is passed through the Layout, Size, Style, and Paint processed by the browser, while the rest is passed through the paint, size, layout, and style process when the user scrolls to that part. Using the content-intrinsic-size CSS Property along with the Content-visibility CSS Property is also required to keep the scrollbar under the user’s control during scrolling.
Thanks to “Content-visibility: auto;” CSS Value and Property, the loading of the upper and visible part of the web page can be prioritized, so the Speed Index Score is improved by increasing the visual completion speed of the upper part of the web page.
“Content-visibility: auto;” it is currently a CSS Property and Value for Chrome only.
Last Thoughts on Speed Index and Holistic SEO
Speed Index is a basic metric related to Web Page Performance Metrics, User-centric Metrics, Perceptional Page Speed, SEO, and UX concepts. Considered within the scope of Holistic SEO, it is important for the fastest implementation of both Conversion Rate Optimization and Search Intent. There is a direct proportion between a good Speed Index Score and a good Initial Contact.
How Speed Index is measured is also important for Holistic SEO. We mentioned that Lighthouse’s Speed Index measurement method and Webpagetest’s Speed Index measurement method are different. Knowing and understanding the differences that developers experience in Speed Index measurement and the way they overcome the barriers they face for Speed Index measurement gives an SEO depth to Pagespeed Optimization.
In the Speed Index Guideline, we discussed the importance of 21 Speed Index optimization methods, 2 different Speed Index measurement methods and related concepts, other relevant web page loading performance metrics. In light of new information, the Speed Index Optimization and Measurement guideline will continue to be updated.
- B2P Marketing: How it Works, Benefits, and Strategies - April 26, 2024
- SEO for Casino Websites: A SEO Case Study for the Bet and Gamble Industry - February 5, 2024
- Semantic HTML Elements and Tags - January 15, 2024



Thank you for such an in-depth guide! I improved LCP and FCP on my site, but Speed Index is still bad.
The digital landscape is evolving at an unprecedented pace, and with it, the importance of understanding intricate web performance metrics. One such metric that often leaves webmasters scratching their heads is the Speed Index. Enter the blog post, “Speed Index Unveiled: The Ultimate Guide to Web Performance Metrics.” This piece is nothing short of a revelation!
From the get-go, the author dives deep into the essence of the Speed Index, breaking down its significance in layman’s terms. For those unfamiliar, the Speed Index measures how quickly the content of a webpage is visibly populated. It’s a crucial metric for understanding user experience, especially in an age where every millisecond counts.
What truly sets this blog post apart is its comprehensive approach. The author doesn’t just stop at defining the Speed Index; they delve into its real-world implications, offering insights into how it impacts SEO rankings, user retention, and overall website credibility. The use of real-life examples, coupled with easy-to-understand infographics, makes the content both engaging and educational.
Another commendable aspect of this post is its actionable advice. The author provides readers with a step-by-step guide on how to improve their website’s Speed Index, from optimizing images to leveraging browser caching. These tips are invaluable for anyone looking to enhance their website’s performance and, by extension, their user experience.
In conclusion, “Speed Index Unveiled: The Ultimate Guide to Web Performance Metrics” is a must-read for anyone in the digital realm. Whether you’re a seasoned web developer or a newbie blogger, this post offers a wealth of knowledge that can help you stay ahead of the curve. Kudos to the author for shedding light on such a pivotal topic in an engaging and enlightening manner!